ClearGov

A Dynamic Financial Transparency & Benchmarking Platform for Local Governments

 It has been traditionally hard to understand the typical financial statements of most governments and citizens do not feel fluent in the language of cash flow statements, balance sheets etc to really understand how money is being spent. At the same time, a vast majority of local governments officials attempt to make economics easier to understand, but they lack tools to efficiently communicate it to the community.

ClearGov was launched in June of 2015 with the goal of helping average citizens better understand how the tax system is working and how the local government is performing.The vision is that through better understanding citizens will want to get more involved in their local government and help drive positive change.

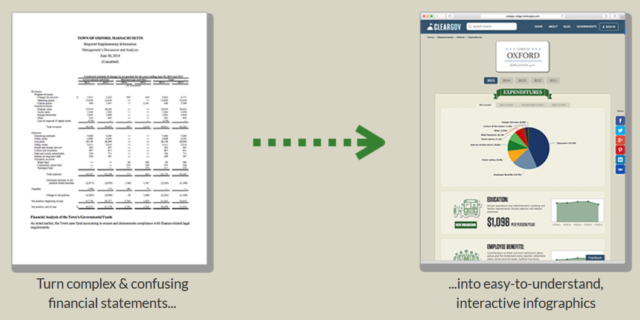
The basic objective of ClearGov is to turn complex and confusing financial statements into easy-to-understand interactive infographics. More specifically, the features that are provided by this service are the following:

  1. Drive citizen trust & Understanding: People usually don’t trust what they don’t understand. By clearly communicating where the government’s money comes from and where the money goes you are conveying an openness that will drive trust and understanding. 
  2. Add commentary to any figure: Numbers by themselves never tell the full story and can even be misleading. So we give you the ability to add commentary to any figure to better communicate the full picture. 
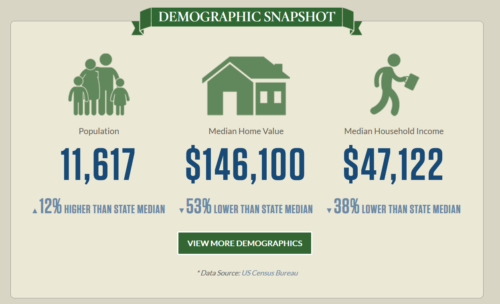
  3. Add ClearGov‘s demographics module: There are many factors that drive budgetary decisions at the municipal level. Our demographics module helps inform visitors of the dynamics your administration must consider when planing for the future.

    cleargov2

    Demographics module by ClearGov for the town of Athol (US), Source: ClearGov.

  4. Save time by reducing incoming requests: Departmental and citizen data requests can bottleneck your organization. ClearGov offers a self-serve alternative that saves your team time and allows you to focus on more strategic tasks.
  5. Add recent and forward-looking financials: Providing easy access to budgetary data gives internal stakeholders the information they need to do their job and can help everyone get on the same page.
  6. Allow visitors to drill deeper: Many taxpayers feel their government has something to hide. Providing deeper granularity to your finances will help not only communicate how tax dollars are being allocated, but also increase trust and understanding.

  7. Make more informed, data-driven decisions: Having a clear view of trends and anomalies can offer insights that are often difficult to see in spreadsheets. ClearGov makes data available in a user-friendly experience that lends itself to better budgeting and policy making decisions.
  8. Add interactive charting: Upgrading your municipal ClearGov page activates historical, interactive charting that help you see trends before they become a problem and uncover new insights.
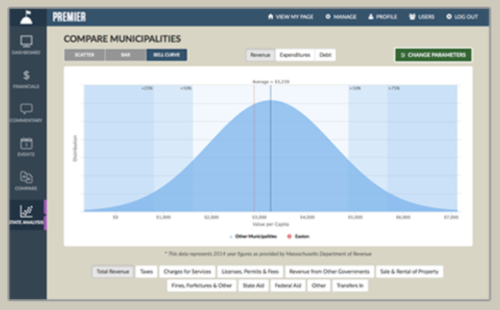
  9. Access powerful benchmarking tools: The easy-to-use back-office benchmarking tools allow users to slice and dice ClearGov‘s deep municipal database to better assess your budget against peer communities.
cleargov3

ClearGov’s benchmarking tools, Source: ClearGov.

ClearGov offers two types of services:

  • a free one that includes basic features such as financials overview, summary level revenues and expenditures and demographic snapshot
  • a plus+ version that includes advanced tools and features such as the ones presented above.

Several local governments of the USA are currenltly using this application, such as:

More information about cities and states that use the application can be found here.