Building Energy Benchmarking

An open-source energy benchmarking results visualization tool for large commercial facilities to help cities mitigate the causes of climate change

Building Energy Benchmarking is a visualization tool that makes it possible for cities to view energy usage for individual buildings. Through maps, charts and statistics, it is possible to hone in on a region of interest and view energy usage statistics of individual buildings.

This tool is open-source and it was developed for the Mayor’s Office of Sustainability (MOS) of the city of Philadelphia by Azavea Inc. The maps are based on OpenStreetMap and CartoDB.

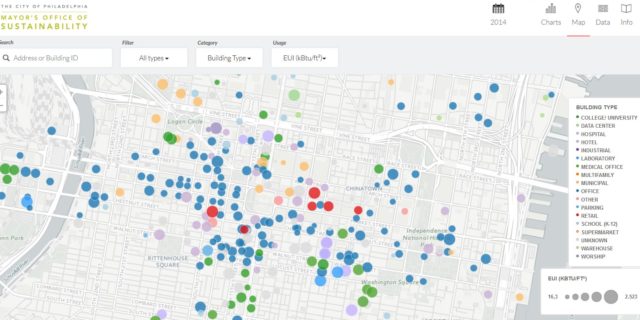
 

There are many different ways to filter, classify, and size the displayed buildings by tweaking a variety of variables. Once a building of interest is selected, a full energy use report can be pulled up, which displays how the building ranks among all others. A comparison tool is also available for side-by-side comparisons of up to three buildings.

An example of bar-chart energy visualization for Philadelphia.

Philadelphia

This visualization tool provides building-level energy performance data for the 2013 and 2014 calendar years for the nearly 2,000 properties required to report utility information as part of Philadelphia’s energy benchmarking law.

Building energy performance is a critical metric for cities dedicated to reducing greenhouse gas emissions. In Philadelphia, more than 60 percent of citywide greenhouse gas emissions stem from building energy use. As part of the City’s Greenworks sustainability plan, Philadelphia set a goal to reduce emissions 20% by 2015. Improving building performance will help Philadelphia reach that goal, and benchmarking provides building owners with the information they need to begin making informed decisions about upgrading and investing in energy efficiency.