Citizen Dan

Community Indicators for Local Communities

Citizen Dan is a free, open source system available to any community and its citizens to measure and track indicators of local well being. It can be branded and themed for local needs. It is under active development by Structured Dynamics with support from a number of innovative cities.

It is a complete turnkey environment for collecting and measuring and tracking and reporting indicators of local well being. It is a data appliance and network (DAN), specifically oriented around community indicator systems.

Citizen Dan is a:

  • Appliance for slicing-and-dicing and analyzing data specific to local community indicators
  • Framework for dynamically navigating, interacting with, or browsing data and concepts
  • Means to visualize local data over time or by neighborhood
  • Meeting place for the public to upload and share local data and information
  • Web data portal that can be individually tailored by any local community
  • Potential node in a global network of communities across which to compare indicators of community well-being.

Citizen Dan’s information sources may include Census data, the Web, real-time feeds, government datasets, municipal government information systems, or crowdsourced data. Information can range from standard structured data to local narratives, including from minutes and reports, contributed stories, blogs or news outlets. The ‘raw’ input data can come in essentially any format, which is then converted to a standard form with consistent semantics.

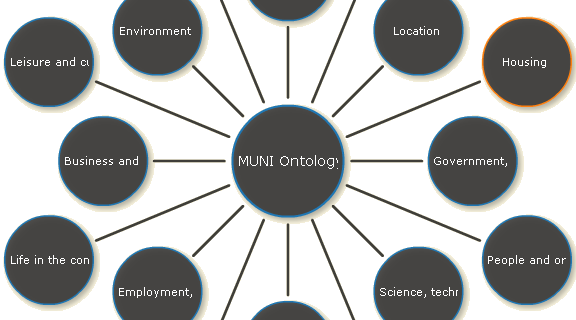
Text and narratives and the concepts and entities they describe are integrally linked into the system via information extraction and tagging. All ingested information, whether structured or text sources, with their semantics, can be exported in multiple formats. A standard organizing schema, also open source and extensible or modifiable by all users, is provided via the optional MUNI ontology (with vocabulary details in development here), being developed expressly for Citizen Dan and its community indicator system purposes.

All of the community information contained within a Citizen Dan instance is available as linked data.

Here are the main components or widgets of the Citizen Dan:

  • Concept Explorer — this Flex widget (also called the Relation Browser) is a dynamic navigator of the concept space (ontology) that is used to organize the content on the instance. Clicking on a bubble causes it to assume the central position in the diagram, with all of its connecting concepts shown. Clicking on a branch concept then causes that new node to assume the central position, enabling one to “swim through” the overall concept graph. For this instance of Citizen Dan, the MUNI ontology is used; a diagram shows the full graph of the MUNI structure.
  • Story Viewer — any type of text content (such as stories, blog posts, news articles, local government reports, city council minutes, etc.) can be submitted to the system. This content is then tagged using the scones system (subject concepts or named entities), which then provides the basis for linking the content with concepts and other data. The story viewer is a Flex widget that highlights these tags in the content and allows searches for related content based on selected tags.
  • Map Viewer — the map viewer is a Flex widget that presents layered views of different geographic areas. The title bar of the viewer allows different layers to be turned on and off. Clicking on various geographic areas can invoke specific data and dashboard views.
  • Charting Widgets — the system provides a variety of charting options for numeric data, including pie, line and bar charts. These can be called directly or sprinkled amongst other widgets based on a dashboard specification.
  • Filter Component — the filter, or browse, component provides the ability to slice-and-dice the information space by a choice of dataset, type of data or data attribute. These slices then become filter selections which can be persisted across various visualizations or exports.
  • Search Component — this component provides full-text, faceted search across all content in the system; it may be used in conjunction with the filtering above to restrict the search space to the current slice.
  • Dashboard Viewer — a dashboard is a particular layout of one or more visualization widgets and a set (or not) of content filtering conditions to be displayed on a canvas. Dashboard views are created in the workbench (see next) and given a persistent name for invoking and use at any other location in the application
  • Workbench — this rather complex component is generally intended to be limited to site administrators. Via the workbench, records and datasets and attributes may be selected, and then particular views or widgets obtained. When no selections are made in the lefthand panel, all are selected by default. Then, in the records viewer (middle upper), either records or attributes are selected. For each attribute (column), a new display widget appears. All display widgets interact (a selection in one reflects in the others). The nature of the data type or attribute selected determines which available widgets are available to display it; sometimes there are multiples which can be selected via the lower left dropdown list in any given display panel. These various display widgets may then be selected for a nameable layout as a persistent dashboard view.
  • Exporter — the exporter component appears in multiple locations across the appliance, either as a tab option (e.g., Filter component) or as a dropdown list to the lower right of many screens. A variety (and growing!) number of export formats are available. When it appears as a dropdown list, the export is limited to the currently active slice. When invoided via tab, more export selection options are available. See further the technical documentation for this component
  • Other Tools— a number of other tools are available to admins:
    • Importer — like the exporter, there are a variety of formats supported for ingesting data or content into the system. Prominent ones include spreadsheets (CSV), XML and JSON. The irON notation is especially well suited for dataset staging for ingest. At import time, datasets can also be appended or merged.
    • Dataset Submission and Management — new datasets can be defined, updated, deleted, appended and granted various access rights and permissions, including to the granularity of individual components or tools.
    • Records Manager — every dataset can have its records managed via so-called CRUD rights. Depending on the dataset permissions, a given user may or may not see these tools.

The sample data and content presented at http://demo.citizen-dan.org is for the Iowa City (IA) metropolitan statistical area. This area embraces two counties (Johnson and Washington) and the census tracts and townships that comprise them, and about two dozen cities. Two of the notable cities are Iowa City itself (see infobox), home of the University of Iowa, and Coralville, where Structured Dynamics, the developer of Citizen Dan and the Open Semantic Framework (OSF), is headquartered.

The text content on this site is drawn from Wikipedia articles dealing with this area. About 30 stories are included.

The data content on the site is drawn from US Census Bureau data.