Visual Budget

An open source budget visualization application

Visual Budget is a free open-source web application and platform that allows any government or citizen group to install and prepare their own public budget visualizations. It has been developped by a civic tech consultancy, called VisGov (Visual Government). It is a working group that has emerged from the award-winning Arlington Visual Budget project, with diverse backgrounds in technology, software engineering, user experience design, and municipal finance.

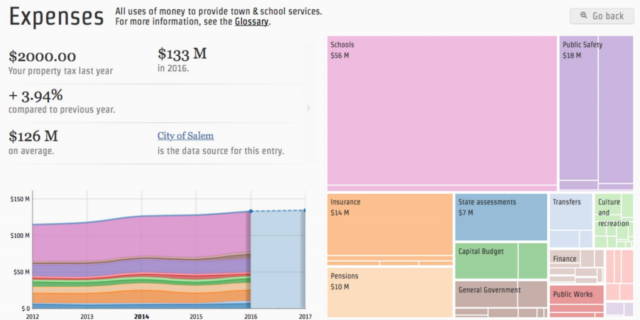
Similar to popular paid solutions from companies like OpenGov and Socrata, VisGov’s free budget visualization tool helps users understand budget figures with interactive and color-coded diagrams. Citizens can see an overview of expenditures and revenues, then dive deeper for insights into specific funding categories.

Visual Budget is freely distributed under the Apache 2 license.

With the code on GitHub, Visual Budget, minus minor deployment and maintenance costs, is essentially free. With a little bit of internal or external IT support, cities can launch the app on their sites. Updating financials is fairly straightforward and can be done via a spreadsheet, without coding. And since users often represent a minority of interested citizens, there is typically a low volume of visitors.

Additionally, VisGov’s graphing library marries the latest technology with the design and experience requirements of government professionals and citizens. Budget data can be displayed to the maximum detail available in the data. Using the latest data-processing and human-interface technology, the software does the work and make it truly easy for the user.

Furthermore, other features of this application are the following:

  • Affordable “starter kit” available to help you get started
  • Simple data format (CSV by line item)
  • Compatible with all budget information systems
  • Direct links to the sources of the data
  • Presents past actuals, current budgets, and forecasts
  • Data available for download
  • Easily discerned trends
  • Includes glossary of relevant financial terms and concepts
  • Retrieves data directly from popular financial software (future feature)

According to the co-founders of VisGov Alan Jones and Annie LaCourt, the app is used in 15 localities so far, and a handful of jurisdictions are preparing to deploy it soon. The state of Massachusetts has also awarded the two a $40,000 grant to develop the tool into interactive visuals that can be placed in any website. Arlington-based design firm Involution Studios also supports the app by serving as its technical partner.